

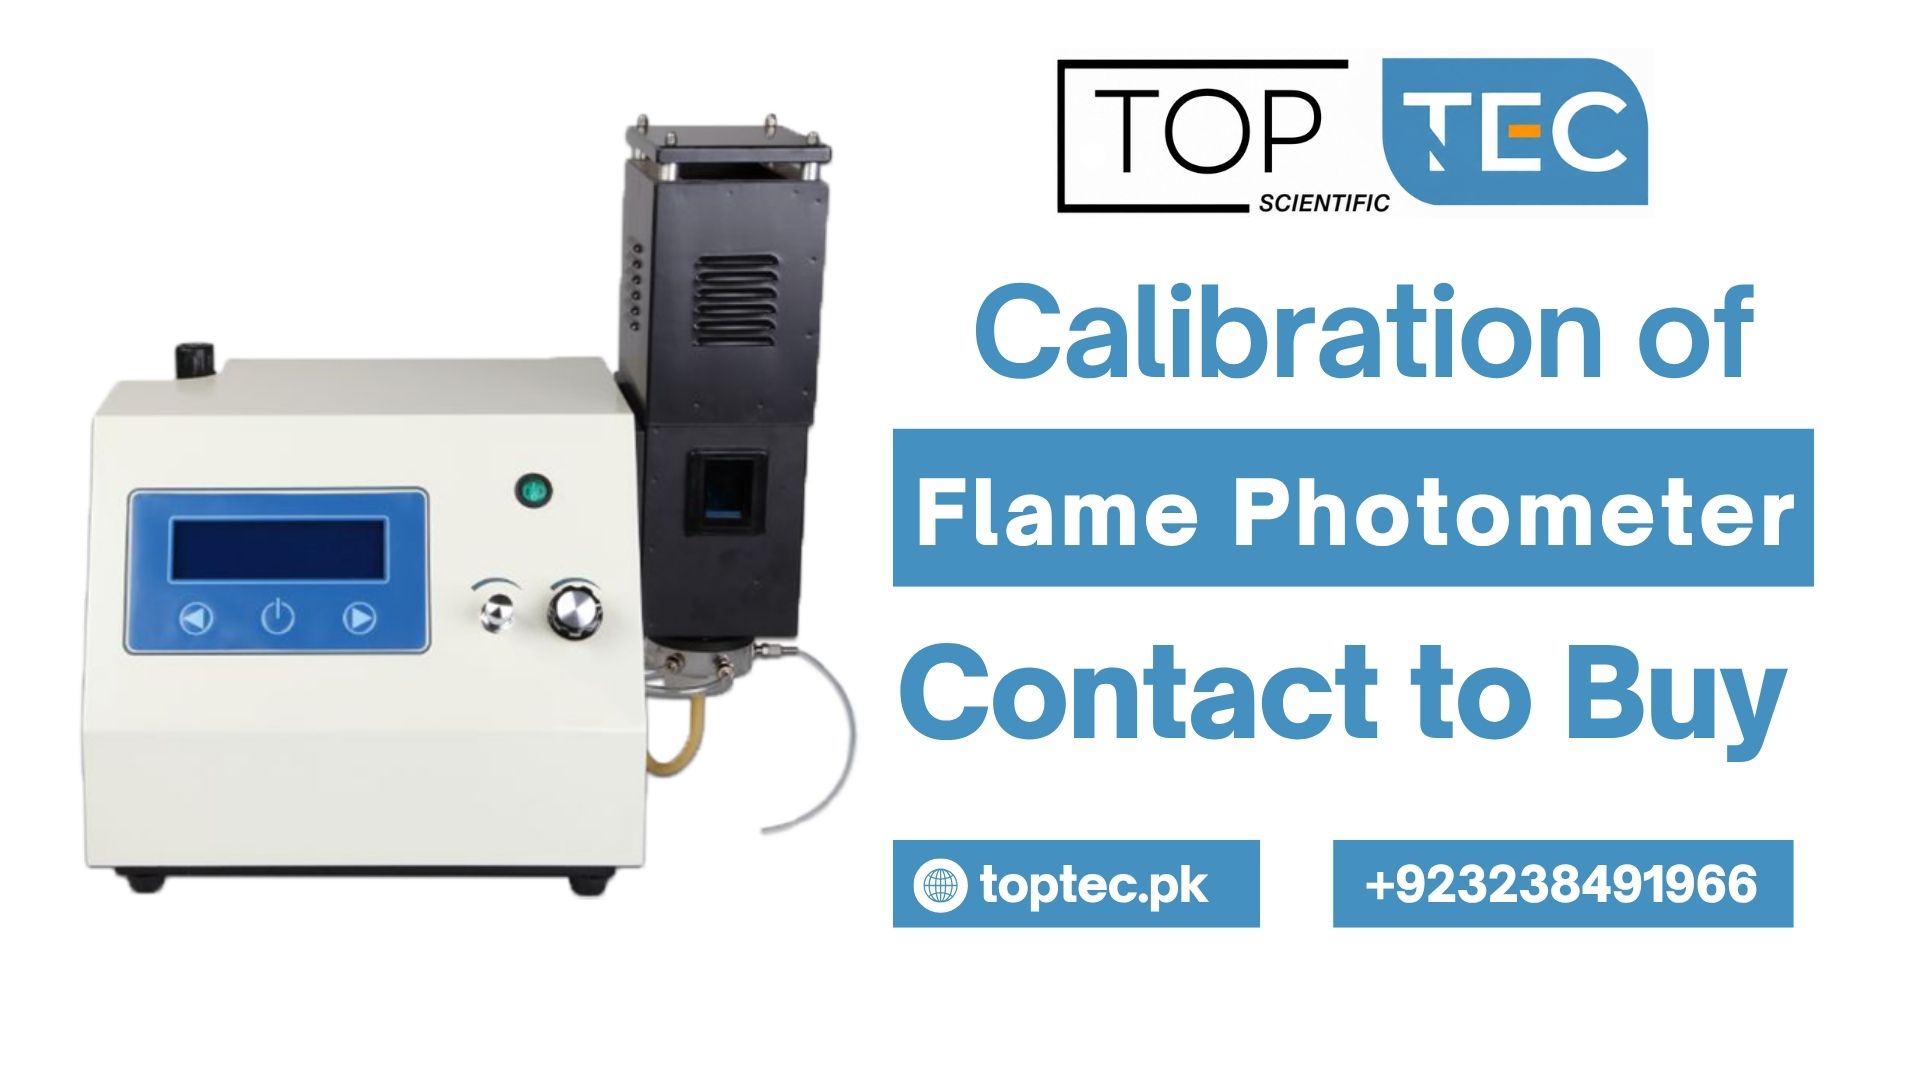
Calibration of flame photometer for clinical, agricultural, and environmental labs. Step-by-step guide covering sodium and potassium standard preparation, quality control, and calibration frequency for accurate elemental analysis.
Here’s something that every analyst who works with a flame photometer eventually discovers — usually at the worst possible moment. You’ve prepared your standards, warmed up the instrument, run your calibration sequence, and everything looks fine on paper. Then your QC check comes back off by 12%. Or your unknown samples are giving you readings that make absolutely no sense given what you know about the matrix. Or worse, the readings are drifting so badly mid-run that you can’t trust a single data point from the last hour.
Sound familiar? You’re not alone.
Flame photometer calibration problems are among the most commonly encountered issues in analytical chemistry labs — and they’re also among the most misdiagnosed. People assume the instrument is broken when the problem is actually the standards. They replace parts when the real issue is the gas supply. They repeat the entire calibration of flame photometer process five times without fixing the underlying fault because they don’t know exactly where to look.
That’s exactly what this article is here to fix.
We’re going to go through every major flame photometer calibration error that labs encounter in real-world practice — not just the textbook ones — and give you clear, practical guidance on what’s actually causing each problem and how to resolve it. We’ll also talk about the role your physical lab environment and workspace play in calibration quality, and why when you Buy Laboratory Furniture for analytical work, the choice of supplier matters more than most purchasing managers realise.
Let’s work through this properly.
Why Flame Photometer Calibration Goes Wrong — The Big Picture
Before we get into individual errors, it helps to understand why calibration of flame photometer instruments is inherently more susceptible to problems than calibration on many other analytical platforms.
Flame photometry is a technique that depends on a chain of interconnected physical and chemical processes. Sample is aspirated. It’s nebulized into fine droplets. Those droplets are carried into a flame by a carrier gas. The flame excites metal ions in the sample. The excited ions emit light at characteristic wavelengths. A filter or grating selects the analyte wavelength. A photodetector converts light intensity to an electrical signal. That signal is processed and displayed as a concentration value.
Every single step in that chain is a potential source of error. If anything changes — gas pressure, aspiration rate, nebulizer geometry, ambient temperature, filter condition, standard quality — your calibration curve flame photometer shifts, and results become unreliable.
That’s not a design flaw. It’s just the nature of the technique. The analysts who get consistently clean calibrations are the ones who understand where the vulnerabilities are and systematically control for them. That’s what this guide teaches you to do.
Problem #1 — Drifting Readings That Won’t Stabilise
This is probably the single most common complaint in flame photometer calibration work. You aspirate a standard, watch the display, and instead of settling on a stable value, the reading just keeps creeping up, creeping down, or oscillating.
What’s Usually Causing It
Insufficient warm-up time. This accounts for probably 60–70% of drift problems. A flame photometer that hasn’t reached thermal equilibrium will give you drifting readings throughout the session. The detector hasn’t stabilised. The optics haven’t reached their operating temperature. The gas flow pathways haven’t cleared residual moisture.
The minimum warm-up time before beginning any calibration of flame photometer procedure is 15–20 minutes, and that’s the minimum for a well-maintained instrument in a stable environment. In cold weather, or after the instrument has been sitting unused for a while, you may need 30 minutes or more before the readings stabilise enough to trust.
Unstable gas supply pressure. The flame is the engine of the whole technique. If your gas supply pressure is fluctuating — even slightly — the flame temperature changes, the aspiration characteristics change, and your readings drift. Check your regulator. If it’s a shared gas line serving multiple instruments, other equipment starting and stopping can cause pressure pulses that show up in your flame photometry readings.
Partially blocked nebulizer tip. Salt deposits, particulate matter from previous samples, or mineral buildup can partially occlude the nebulizer, causing an irregular aspiration rate. The reading bounces around because the amount of sample reaching the flame is inconsistent.
Air currents in the lab. Yes, this is real. A flame photometer placed near an open window, an HVAC vent, a fume hood exhaust, or even a high-traffic corridor will experience variations in flame stability caused by air movement. This is one of the reasons your physical lab setup — including where your instrument is positioned and what it’s sitting on — directly affects your flame photometer calibration quality.
How to Fix It
Extend your warm-up time. Seriously — just give it more time. Check your gas pressure regulator and confirm it’s within the instrument specification range. Clean your nebulizer tip with the manufacturer-specified cleaning wire (not a metal wire if the specification says otherwise — you can damage the tip). Position the instrument away from air movement sources. If you’re in a shared lab, be aware of when other equipment fires up and whether it’s creating pressure pulses in your gas supply.
Problem #2 — Poor R² Value on the Calibration Curve
You plot your calibration curve flame photometer data, run the linear regression, and the R² comes back at 0.987 or 0.991. That sounds close to 1.0 — but for regulated analytical work, it’s not good enough. Most method protocols require R² ≥ 0.999. So what’s going wrong?
What’s Usually Causing It
Improperly prepared standards. This is the most common root cause of a poor calibration curve flame photometer, and it’s the one that analysts are sometimes slowest to admit. Errors in volumetric preparation — slightly under or overfilled volumetric flasks, imprecise pipetting, using a standard past its use-by date, drawing from a stock solution that’s been contaminated — all produce standards whose actual concentrations don’t match their nominal concentrations. When you plot them, the curve scatters.
Carryover between high and low concentration standards. If you aspirate your 200 ppm standard and then immediately move to your 10 ppm standard without an adequate rinse, residual analyte in the aspiration system will make the 10 ppm read higher than it should. Your low-concentration points get pulled upward, the curve loses linearity at the bottom, and your R² suffers.
Non-linearity at high concentrations. At high analyte concentrations, self-absorption can cause the response to deviate from linearity — the emission signal levels off rather than continuing to rise proportionally. If you’re including standards above the linear dynamic range, they’ll pull your curve out of shape and trash your R².
Matrix effects. If your standards don’t match your sample matrix, dissolved solids, organic content, or ionic strength differences between standards and samples affect aspiration rate and flame chemistry differently. The standards follow one response curve; the samples follow a slightly different one. The result is apparent non-linearity in your calibration of flame photometer data.
Glassware contamination. Sodium and potassium are essentially everywhere. Fingerprints on volumetric flasks. Residual contamination from previous solutions. Inadequate rinsing. These introduce random errors in your lower-concentration standards especially, causing those points to scatter and pull your R² down.
How to Fix It
Prepare fresh standards from a validated, in-date stock solution using properly cleaned and calibrated volumetric glassware. Always wear gloves — your skin deposits sodium on anything it touches. Rinse thoroughly between standards — at least 20–30 seconds of deionized water aspiration between each point. Check the upper end of your curve for self-absorption effects by testing whether your highest standard falls on the regression line or below it. If it’s below, you’re in the non-linear range and need to either narrow your calibration range or use a different analytical strategy. For complex matrices, matrix-match your standards to the sample composition.
Problem #3 — Blank Doesn’t Read Zero (or Won’t Stay at Zero)
You zero the instrument with your blank. Fine. But five minutes later, the blank is reading 3 or 5 or 8 on the display. Or it never settled to zero in the first place, no matter how many times you adjusted the zero control.
This is a particularly insidious problem because it silently errors every subsequent measurement in your calibration of flame photometer session.
What’s Usually Causing It
Blank solution contamination. Sodium and potassium contamination in your supposedly deionized water blank is the first thing to check. This can come from:
- Deionized water that’s been sitting in a plastic container for too long (plastics leach ions)
- Deionized water that’s been drawn from a cartridge system past its service life
- A sample cup or aspiration tube that wasn’t adequately rinsed
- Handling the blank container without gloves
Residual contamination in the aspiration system. If a previous session involved high-concentration sodium or potassium samples, residual contamination can persist in the nebulizer, spray chamber, and burner head even after rinsing. You zero the blank, but the residual analyte slowly releases and the reading creeps back up.
Atmospheric contamination. In labs where sodium or potassium compounds are handled openly — weighing operations, open reagent containers, dusty environments — airborne contamination can affect your blank and low-concentration standards. This is more of an issue than most analysts acknowledge.
The instrument itself needs cleaning. Salt deposits on the burner head, in the spray chamber, or on the burner orifice slowly release ions into the aspiration stream, giving a background signal that won’t zero out properly.
How to Fix It
Prepare a fresh blank using ultra-pure water from a freshly purged dispensing system, in a properly cleaned and rinsed container, handled only with gloves. Rinse the entire aspiration system extensively — aspirate ultra-pure water for 5–10 minutes before attempting to zero. If the problem persists, the burner head and spray chamber need physical cleaning according to the instrument manufacturer’s protocol. Check your deionized water quality with a conductivity meter — if it’s above 1–2 µS/cm, it’s not pure enough for calibration of flame photometer work with sodium and potassium at low concentrations.
Problem #4 — QC Check Standard Fails Tolerance
You’ve built what looks like a perfectly good calibration curve flame photometer, verified it with a check standard prepared from the same stock as your calibration standards — and it passes easily. But your independently prepared QC check standard, drawn from a different stock solution, fails the ±5% tolerance criterion.
This failure pattern is actually one of the most informative diagnostic results in flame photometer calibration work, because it tells you something specific: the problem is in your standards, not your instrument.
What’s Usually Causing It
The calibration standard stock solution has an error. If your calibration curve was built from standards prepared from a stock with the wrong actual concentration — expired, incorrectly stored, mislabeled, or contaminated — and then you check against an independently prepared QC standard from a different, correct stock, the discrepancy between the curve and the check standard reveals the stock solution error.
The QC standard itself is wrong. It works the other way too. If the QC standard has the preparation error, it will appear to fail a perfectly good calibration. Always be systematic about which side of the discrepancy you investigate first.
Calibration drift between building the curve and running the check. If significant time passed between your last calibration point and your QC check — particularly if the instrument was left running but not aspirating, allowing the flame to destabilize — the response function may have shifted. The curve no longer accurately represents the instrument’s current response.
Wavelength filter degradation. Older interference filters degrade over time and with exposure to UV from the flame. As the filter transmission characteristics change, the instrument’s sensitivity changes — and a calibration built on an old filter will drift as the filter continues to degrade.
How to Fix It
First, verify both stock solutions independently if you can — compare against a certified reference material or have them checked on another calibrated system. Replace the standard that’s in question. Rebuild your calibration curve flame photometer fresh. If drift is occurring between calibration and QC check, reduce the time gap between them and consider re-running calibration more frequently during long analytical sessions. If filter degradation is suspected, inspect the filter for visible deterioration and replace if necessary — this is a routine maintenance item that gets overlooked in many labs.
Problem #5 — Interferences Between Elements
You’re measuring potassium in a sample that also contains high concentrations of sodium. Or you’re measuring calcium in the presence of phosphate. And your readings are systematically biased — consistently too high or consistently too low in ways that don’t make sense based on your calibration.
This is a matrix interference problem, and it’s particularly relevant to the calibration of flame photometer work in complex biological and environmental matrices.
What’s Usually Causing It
Spectral interference. Even with high-quality narrow-band interference filters, there can be overlap between emission spectra of different elements. High concentrations of one element can contribute stray light intensity to the channel being monitored for another element. The classic example in clinical flame photometry is sodium’s very intense 589 nm emission bleeding into adjacent wavelength channels.
Ionisation interference. When easily ionised elements like potassium are present in high concentrations alongside other analytes, they affect the degree of ionisation of those analytes in the flame. This changes the number of excited neutral atoms available to emit at the analyte wavelength, causing a systematic bias that can push readings either higher or lower.
Chemical interference. Certain anions — particularly phosphate and sulfate — form stable compounds with calcium and barium in the flame, suppressing their atomisation and therefore their emission signal. This causes systematic underestimation of calcium or barium when phosphate or sulfate levels are high.
Viscosity and surface tension effects. High dissolved solids content in complex matrices changes the aspiration rate and nebulisation efficiency compared to your calibration standards in simple aqueous matrix. The sample gets to the flame differently than the standard — more or less of it per unit time — causing a proportional bias.
How to Fix It
For spectral interferences, verify your filter condition and ensure you’re using the correct filter for each element. Increase spectral resolution if your instrument supports it. For ionisation interferences, add an ionisation suppressor — a high concentration of an easily ionised element like caesium or lanthanum to both standards and samples equalizes the ionisation environment. For chemical interferences, standard addition is often the most robust approach — it accounts for matrix effects because the calibration is built in the actual sample matrix. For viscosity effects, dilute samples to reduce dissolved solids, or again use standard addition. Matrix matching your calibration standards — preparing them in a solution that approximates your sample matrix composition — is the general strategy that addresses most of these effects simultaneously.
Problem #6 — The Calibration Curve Isn’t Linear at High Concentrations
Your calibration curve flame photometer plots beautifully from 0 to 80 ppm and then bends over at 100 ppm and above. The high-concentration points fall below the regression line. Your R² is suffering, and if you use the linear equation to back-calculate those high-concentration standards, you get values lower than you should.
What’s Usually Causing It
Self-absorption. At high analyte concentrations, ground-state atoms in the cooler outer regions of the flame absorb some of the emission from excited atoms in the hotter inner flame core. The net emission detected is less than expected from a simple linear extrapolation of the lower-concentration response. This effect becomes progressively more pronounced as concentration increases, causing the classic S-shaped curvature at the high end of the calibration curve flame photometer.
Detector saturation. In some instrument configurations, the photodetector or its associated electronics saturate at very high emission intensities, causing the measured signal to level off even as actual emission continues to increase.
How to Fix It
This one is actually straightforward — narrow your calibration range. Identify the upper concentration at which the response is still linear (your last point that falls cleanly on the regression line) and treat that as your upper limit of quantitation. Dilute any samples that exceed this concentration before analysis. Don’t try to work with a non-linear calibration curve by using a quadratic fit unless your method explicitly calls for it and it’s been properly validated — the extra uncertainty in the fitted curve introduces errors that compound unpredictably.
Problem #7 — Erratic, Irreproducible Readings from Sample to Sample
This one is maddening. You aspirate the same standard three times and get three readings that are all substantially different. Or you split a sample into two cups and measure both aliquots separately, getting a 15% discrepancy between them.
When your flame photometer calibration is solid but your replicate measurements are all over the place, you have a precision problem rather than an accuracy problem. They’re different issues with different causes.
What’s Usually Causing It
Partially blocked or worn nebulizer tip. An irregular nebulizer produces an irregular aerosol — different amounts of sample reaching the flame in different reads, causing genuinely variable emission intensity. If the tip is partially blocked, the aerosol droplet size distribution becomes inconsistent, further compounding the problem.
Air bubble entrainment. If the sample cup is running low and the aspiration tube is drawing air along with liquid, you’ll see very erratic readings. Always ensure adequate sample volume in the cup — most instruments need at least 5–10 mL of sample above the tip of the aspiration tube to avoid air entrainment.
Sample viscosity variation. If your samples have significantly different viscosities (comparing a water sample to a serum sample, for example), the aspiration rate and nebulisation efficiency differ between them. This doesn’t cause random variation within a single sample type, but can look that way if sample types are mixed in a run.
Electrical interference. In labs with heavy electrical equipment nearby — large centrifuges, HVAC compressors, autoclaves — electrical noise can cause erratic photodetector signals. Proper instrument earthing and, if necessary, a clean power supply or UPS can address this.
Vibration transmission through the bench. This comes back to the workspace question again. If your flame photometer is sitting on a lightweight or poorly constructed bench that transmits vibration from nearby equipment or foot traffic, the aspiration tube moves. The nebuliser performance fluctuates. Your readings become erratic. This is a real, documented problem in high-precision analytical work — and it’s one of the reasons why the workbench you choose when you Buy Laboratory Furniture for a flame photometry setup genuinely matters to your data quality.
How to Fix It
Inspect and clean the nebulizer tip. Ensure adequate sample volume. Check and tighten all instrument earthing connections. Consider a clean power supply if electrical interference is suspected. And seriously evaluate your instrument’s physical placement — a heavy, rigid, properly levelled laboratory workbench with a vibration-dampening surface is part of getting good flame photometry data, not just an aesthetic nicety.
Problem #8 — Systematic High or Low Bias on Specific Elements Only
Your sodium calibration looks perfect. Your potassium readings are systematically 10–15% high. Or your calcium results are reproducibly low while sodium and potassium check out fine. Element-specific systematic bias is a specific diagnostic pattern worth recognising.
What’s Usually Causing It
Wrong or degraded filter for that element. Each element requires a specific narrow-band interference filter tuned to its emission wavelength. If the filter for potassium is degraded, has drifted in its transmission characteristics, or is simply the wrong filter installed in that position, the measured signal for potassium will be systematically wrong while other elements (using their own filters) are unaffected.
Incorrect standard for that element. Simple and embarrassing — but it happens. If the stock standard for one particular element has an error in its certified value (which can happen with non-certified or poorly documented standards), every calibration of flame photometer run using that stock will show a systematic bias on that element specifically.
Flame condition for specific element. Different elements have different optimal flame temperatures and compositions for maximum emission. If your flame conditions are set optimally for sodium but are slightly off for calcium (which often benefits from a hotter, oxidizing flame), you may see element-specific performance differences.
How to Fix It
Inspect and if in doubt replace the filter for the affected element. Verify your stock standard against an independently certified reference material. Check your flame condition settings against the instrument specification for each element you’re measuring — some instruments allow per-element flame condition adjustment and the settings may have drifted or been inadvertently changed.
Problem #9 — Inconsistent Results After Changing Standard Lots
This one catches labs by surprise. Everything was working well. New lot of standards arrived. Now the calibration of flame photometer results are offset — consistently higher or lower than they were with the previous lot — and you’re spending hours trying to figure out why.
What’s Usually Causing It
Lot-to-lot variation in standard concentration. Even certified reference standards can have slight variation between lots within their stated uncertainty limits. A new lot at the lower end of its uncertainty range combined with a previous lot at the upper end can produce an apparent shift of several percent — enough to throw your QC checks and inter-lot comparisons.
Different preservative or matrix between lots. Manufacturers occasionally change the preservative acid type or concentration, stabilising agent, or diluent composition between standard lots. These matrix differences can affect aspiration rate, nebulisation efficiency, and flame chemistry in ways that show up as apparent concentration offsets.
How to Fix It
When transitioning to a new standard lot, run both old and new lot standards in parallel during an overlap period. Establish new calibration acceptance criteria or correction factors based on the overlap data if a lot-to-lot offset exists and can be verified. Document the transition in your calibration records. Never switch standard lots mid-analytical run — always start a new run with a freshly built calibration curve flame photometer when changing lots.
Problem #10 — Readings Drop During a Long Analytical Run
Your calibration is perfect at the start of the session. Halfway through a long run, you re-aspirate your mid-range standard for a check — and it’s reading 8% lower than it calibrated at the start. Something has changed.
What’s Usually Causing It
Standard solution degradation or evaporation. Sodium and potassium standards in open cups will experience evaporation over time, particularly in warm labs or near the heat of the instrument. As the volume decreases, the concentration increases — and if you zeroed and calibrated with a fresh cup but are now measuring from a partially evaporated cup, your check readings will be systematically off.
Progressive nebuliser blockage. Salt deposits gradually build up in the nebulizer tip over a long run, progressively reducing the aspiration rate. Readings slowly drop as less and less sample reaches the flame per unit time.
Gas supply pressure decrease. If your LPG cylinder is running low, supply pressure can gradually drop over the course of a long session, causing flame temperature to slowly decrease and emission intensity to slowly drop with it.
Detector fatigue. In some older instruments, prolonged high-intensity emission exposure can cause slight, temporary depression of detector sensitivity. This is less common with modern detectors but worth being aware of.
How to Fix It
Cover standard cups between measurements to minimise evaporation. Use fresh aliquots for QC checks rather than returning to the same open cup. Clean the nebulizer tip mid-session if runs are very long. Monitor gas cylinder pressure before long sessions and change cylinders before they get low. Implement a regular re-calibration schedule during long runs — rebuild your calibration curve flame photometer every 30–40 samples as standard practice rather than waiting for something to go wrong.
The Role Your Lab Workspace Plays in Calibration Quality
We’ve touched on this in several problem sections above, but it deserves its own dedicated discussion because it’s genuinely underappreciated as a contributor to flame photometer calibration problems.
Here’s the reality: even a perfectly maintained, well-specified flame photometer will give you poor calibration of flame photometer results if it’s sitting on the wrong bench, in the wrong location, in a poorly designed workspace.
These are the specific workspace factors that affect your calibration quality:
Bench rigidity and vibration isolation. A heavy, rigid workbench minimises vibration transmission to the instrument. This directly stabilises the nebulizer and aspiration tube, giving you more consistent sample delivery and therefore more stable readings. A lightweight pressed-wood bench that flexes and transmits vibration from footsteps and nearby equipment does the opposite.
Chemical resistance of work surfaces. The work surfaces around your flame photometer need to withstand repeated cleaning with the disinfectant and decontamination solutions you’re using to prevent sodium and potassium cross-contamination between sessions. Epoxy resin and phenolic resin surfaces are ideal — they’re fully sealed, chemically resistant, and genuinely easy to decontaminate. Standard laminate or unsealed wood work surfaces absorb contamination and are never truly clean, which affects your blank values and low-concentration standard reproducibility.
Temperature stability. If your lab has significant temperature swings throughout the day — from solar heating through windows, from HVAC cycling, from nearby autoclaves or ovens — and your instrument is exposed to those swings, your flame photometer calibration will drift as ambient conditions change. Stable lab temperature is a genuine analytical requirement, not just comfort.
Workspace organisation. A cluttered workspace where standards, samples, and waste containers are jumbled together increases cross-contamination risk dramatically. Designated positions for each item in the workflow — ideally supported by a well-designed bench layout — is the kind of organisational infrastructure that good laboratory furniture provides.
Positioning relative to air movement. Fume hoods, HVAC vents, open doors, windows — anything that creates air movement near the instrument affects flame stability and therefore calibration of flame photometer performance. A properly planned lab layout keeps analytical instruments in stable, air-movement-free zones.
None of this happens by accident. It’s the result of deliberate workspace design, built around appropriate, purpose-designed laboratory furniture.
Why Pakistani Analytical Labs Need to Think Carefully About Where They Buy Laboratory Furniture
This conversation is specifically relevant to labs in Pakistan — pharmaceutical QC departments, clinical chemistry labs, soil science facilities, university analytical chemistry departments, food testing units, and environmental monitoring stations that rely on flame photometry as part of their regular analytical toolkit.
The quality of your analytical results is only as good as the environment you generate them in. And the environment you work in is substantially shaped by the furniture and infrastructure your lab is built around.
Here in Pakistan, the traditional approach has been to import laboratory furniture from international suppliers — often at significant cost, with long lead times, currency risk, and after-sales support that amounts to little more than a helpline number that connects to a time zone eight hours away.
That approach is expensive. It’s logistically painful. And increasingly, with quality Pakistani manufacturers now capable of producing laboratory furniture that matches international specifications, it’s also unnecessary.
TOPTEC Scientific is the name that more and more Pakistani labs are turning to when they need to Buy Laboratory Furniture that genuinely supports the precision analytical work their teams do every day.
About TOPTEC Scientific — Built in Pakistan, Built for Pakistani Labs
TOPTEC Scientific is a Lahore-based manufacturer — and when we say manufacturer, we mean they actually design and build their products in Pakistan. Not a reseller. Not an importer with a local label. A genuine manufacturing operation with quality control at every stage of production and a product range built around what Pakistani labs actually need.
When Pakistani pharmaceutical facilities, hospital laboratories, research institutions, university departments, and food testing agencies choose to Buy Laboratory Furniture from TOPTEC Scientific, here’s what that decision delivers in practice:
🏭 Genuine Local Manufacturing
Every bench, cabinet, fume hood, and workstation that leaves the TOPTEC Scientific facility has been designed, fabricated, and quality-checked right here in Pakistan. You know what you’re getting, and there’s full accountability for what you receive.
💰 No Import Premium — Real Budget Value
Remove import duties, freight costs, insurance, customs clearance fees, and currency exchange risk from the equation, and locally manufactured laboratory furniture from TOPTEC Scientific delivers considerably more value per rupee than equivalent imported alternatives. For labs operating under realistic procurement budgets — which covers most labs in Pakistan — this difference is substantial.
⚙️ After-Sales Support That Actually Works
When you need a bench modified, a cabinet repaired, a fume hood serviced, or technical advice about your lab layout, TOPTEC Scientific’s team is locally accessible. In your time zone. Reachable. Able to physically visit your facility when needed. Compare that to chasing international suppliers through email chains across eight time zones and you understand why local support matters so much.
📋 Understanding of Pakistani Regulatory Context
TOPTEC Scientific understands what DRAP inspectors look for, what WHO-GMP auditors expect, and what ISO-accredited clinical labs need from their infrastructure. Their products are designed with this regulatory context already built in — not retrofitted to meet Pakistani requirements as an afterthought.
🔧 Custom Fabrication
Your lab is not a standard dimension. Your workflow is not identical to every other lab. TOPTEC Scientific can work with your specific space, your specific requirements, and your specific application needs to deliver customised laboratory furniture solutions. No international standard product catalog can offer that.
What TOPTEC Scientific Offers When You Buy Laboratory Furniture for Flame Photometry and Analytical Chemistry Labs
When you’re setting up or upgrading a lab where calibration of flame photometer instruments and precision analytical chemistry work takes place, the specific furniture requirements include:
Heavy-Duty Analytical Workbenches — Rigid, vibration-minimising bench systems with epoxy resin or phenolic resin work surfaces that provide the chemical resistance and stability that flame photometry work demands. These are the benches that directly support your flame photometer calibration quality through physical stability and decontaminable surfaces.
Chemical-Resistant Lab Tables — For standard preparation areas where dilute acids, volumetric glassware, and reference standards are handled. Acid-resistant surfaces are a practical requirement here, not an optional upgrade.
Stainless Steel Laboratory Tables — For clinical chemistry environments where hygienic, fully decontaminable surfaces are both a regulatory requirement and a practical necessity for controlling sodium and potassium contamination.
Fume Hoods and Ducted Exhaust Cabinets — For labs where concentrated acid standard preparation or volatile solvent work takes place adjacent to analytical instruments.
Reagent and Chemical Storage Cabinets — Proper storage of certified reference standards in controlled, contamination-free conditions is part of maintaining the integrity of your calibration of flame photometer standards over time. Dedicated storage cabinets — with separate provisions for flammable materials where applicable — are the right infrastructure for this.
Overhead Service Carriers and Utility Systems — Clean, organized gas line routing for LPG or compressed air connections is both a safety requirement and a practical necessity for labs where fuel gases are in daily use for flame photometry.
Laboratory Stools and Ergonomic Seating — Analysts who are physically comfortable during long calibration sessions make fewer handling errors and produce better data. This sounds trivial until you’ve spent six hours on a hard stool trying to keep your calibration curve flame photometer on track.
When you Buy Laboratory Furniture from TOPTEC Scientific, you’re not shopping for individual pieces. You’re investing in a complete analytical workspace — one that actively supports the quality of the work being done within it.
A Practical Pre-Calibration Checklist to Prevent Problems Before They Start
The best way to deal with flame photometer calibration problems is to prevent them from happening. Here’s the checklist we recommend running before every single calibration session:
The Night Before (or First Thing in the Morning):
- □ Check certified reference standard lot numbers, expiry dates, and storage conditions
- □ Verify gas cylinder pressure — never start a long session with a low cylinder
- □ Prepare fresh deionized water for blanks and dilutions (check resistivity ≥18 MΩ·cm)
- □ Clean and inspect all volumetric glassware to be used
At the Start of the Session:
- □ Ignite flame and begin warm-up — minimum 15–20 minutes before calibration
- □ Aspirate deionized water continuously during warm-up
- □ Check and document gas supply pressure
- □ Confirm ambient temperature and log it in calibration records
- □ Verify the correct wavelength filter is installed for each analyte
- □ Prepare working standards fresh from stock solutions using calibrated pipettes and gloves
During Calibration:
- □ Aspirate blank and confirm it settles cleanly to zero before proceeding
- □ Rinse 20–30 seconds between every standard
- □ Aspirate each standard in triplicate and average
- □ Plot your calibration curve flame photometer and confirm R² ≥ 0.999
- □ Run your independent QC check standard and confirm it’s within ±5% before analysing samples
During the Analytical Run:
- □ Re-aspirate blank every 10–15 samples to confirm zero hasn’t shifted
- □ Run QC check standard every 20–25 samples
- □ Cover sample cups and standard cups between aspirations to prevent evaporation
- □ Document everything contemporaneously
At Session End:
- □ Aspirate deionized water for at least 5 minutes to clean the aspiration system
- □ Shut down flame per instrument SOP
- □ Complete calibration logbook entries before leaving the bench
Follow this checklist consistently and you will eliminate the majority of flame photometer calibration problems before they have the chance to affect your data.
Final Thoughts — Better Calibration Starts with Better Preparation
After working through all of these problems and their solutions, the pattern becomes clear. The vast majority of flame photometer calibration problems come from the same cluster of root causes: inadequate preparation, insufficient warm-up, poor standard quality, inadequate rinsing, and — less obviously but just as importantly — a physical workspace that doesn’t support precision analytical work.
The calibration of flame photometer instruments isn’t complicated when the conditions are right. It’s a logical, sequential process with clear acceptance criteria. The difficulty comes when one or more of the foundational conditions — stable instrument, quality standards, controlled environment, proper technique — is compromised.
Fix those foundations, and your calibration curve flame photometer will be linear, your QC checks will pass, your unknown results will be trustworthy, and your calibration documentation will hold up to whatever level of regulatory scrutiny it faces.
And if you’re in Pakistan and you’re thinking about the physical infrastructure that supports that precision work — from bench stability to chemical resistance to workspace organisation — you know where to start that conversation.
📞 Contact TOPTEC Scientific — Pakistan’s Laboratory Furniture Manufacturer
Whether you need to Buy Laboratory Furniture for a new analytical chemistry lab, upgrade your existing workbenches to support better calibration of flame photometer precision, or fit out an entire pharmaceutical QC or clinical chemistry department, TOPTEC Scientific has the manufacturing capability, the regulatory knowledge, and the local support infrastructure to deliver exactly what your lab needs.
TOPTEC Scientific House # 51, Block E, Street # 8, Fathe Abad Academy Road, Nearby Shair Paioo Bridge, Lahore Cantt, Pakistan 🌐 Visit: toptec.pk
Reach out today. Tell their team what you’re working with, what your application demands, and what your budget looks like. They’ll help you build the workspace that your analytical work deserves.
